This post shows how to successfully use machine learning and game metrics, such as card advantage, to predict the outcome of a Hearthstone game.
Being able to predict somewhat reliably the outcome of a Hearthstone game using metrics and machine learning is beneficial for three reasons: First, it helps you to play better by illuminating what are the most important things to pay attention to during a turn. Second, knowing the decisive factors allows you to build a better deck by knowing what to optimize. Finally, it provides a reasoning framework that humans can use to analyze a game quickly.
Hopefully, game casters will start using those metrics to pinpoint game key events. For example, using metrics, it is easy to spot “swing turns,” as they be can defined easily using metrics as follows: A swing turn occurs when the board mana advantage (one of the most predictive metrics) shifts from one player to another by a large margin (think 5 mana on turn 5).
A more “scientific” treatment of the main results described in this blog post are published in this research paper.
This blog post is part of my series of blog posts about applying machine learning to Hearthstone. Here is the list of post available:
- How to price Hearthstone cards: Presents the card pricing model used in the follow-up posts to find undervalued cards.
- How to find undervalued cards automatically: Builds on the pricing model to find undervalued cards automatically.
- Pricing special cards: Showcases how to appraise the cost of cards that have complex effects, like VanCleef.
- Predicting your Hearthstone?s opponent deck: Demonstrates how to use machine learning to predict what the opponent will play.
- Predicting Hearthstone game outcomes with machine learning: Discusses how to apply machine learning to predict game outcomes (this blog post).
Disclaimer: This analysis was done using replays only from 2014. That being said, the results should still apply today, as the game hasn’t fundamentally changed since then. Hopefully, I will be able to redo the analysis using more recent replays at some point.
Analysis overview
Here are the five analysis steps that are covered in this blog post:
-
Defining the metrics: First, the metrics used to predict the game outcome are defined. To create the metric set, ideas were drawn from various Reddit discussions and my previous research on card valuation.
-
Testing the predictive power of the metrics: Using 50,000 replays, we first look at how each of those metrics correlates with the win rate over the turns. Then we discuss how the results shed some insights about the various factors that affect the win rate.
-
Analyzing the impact of lead size: In this step, we take a closer look at how various sizes of the lead for various metrics affect the win rate to see what additional insights we can gather.
-
Predicting game outcomes: In this section, we focus on predicting game outcomes by combining our metrics using various machine-learning algorithms.
-
Why having a lot of data matters: Last but not least, the last part of the post is dedicated to showcasing how dangerous it is to run this type of analysis without enough data by showing how (in)accurate the correlation analysis is when using 100, 1000 and 10,000 games.
Game metrics
Over the years, the Hearthstone community has come up with a few metrics that are routinely used to guess who will win a game. Combining the community metrics with the results of my previous research that shows the linear relation between mana cost and card power level, I came up with the following potential metrics.
-
Mana advantage: The mana advantage metric is the difference between how much mana the player spent versus how much their opponent spent. So, if the player has spent 4 mana and their opponent has spent 2 mana, then the mana advantage is: 4 - 2 = 2.
Conversely, if the opponent spent 6 mana and the player spent only 2 mana, the mana advantage is 2 - 6 = -4. Given that according to my card pricing model, the power of a card is (almost) perfectly reflected by its mana price, I was expecting that this metric would be the most predictive (and it is!).
-
Board advantage: The board advantage metric measures the difference between how many minions the player has in play versus how many minions the opponent has in play.
-
Board mana advantage: The board mana advantage metric is the difference between the sum of the mana for the cards that the player has on the board versus the sum of the mana for the cards the opponent has on the board. Given the relation between mana cost and power level, this metric should be a better predictor than the sheer number of creatures on the board, as our model implies that a 3-mana creature is more powerful than two creatures that cost 1 mana.
-
Draw advantage: The draw advantage metric measures who drew the most cards by calculating the difference between how many cards the player has drawn so far and how many cards their opponent has drawn. For instance, if the player has drawn four cards and their opponent has drawn two, then the draw advantage is 4 - 2 = 2. Our card value analysis predicts that the value of having a card is a fraction of the card’s mana cost, so this metric should be a weak indicator.
-
Hand size advantage: This metric refers to how many cards the player has in their hand versus how many cards the opponent has in theirs. It is a somewhat strange metric, but many casters and players refer to it, so it was included. If the player has two cards in their hand and the opponent has three cards, then the hand size advantage is 2 - 3 = -1. It turns out that this metric has very interesting behavior, so it was a worthwhile inclusion in the set.
Flavors of the metrics
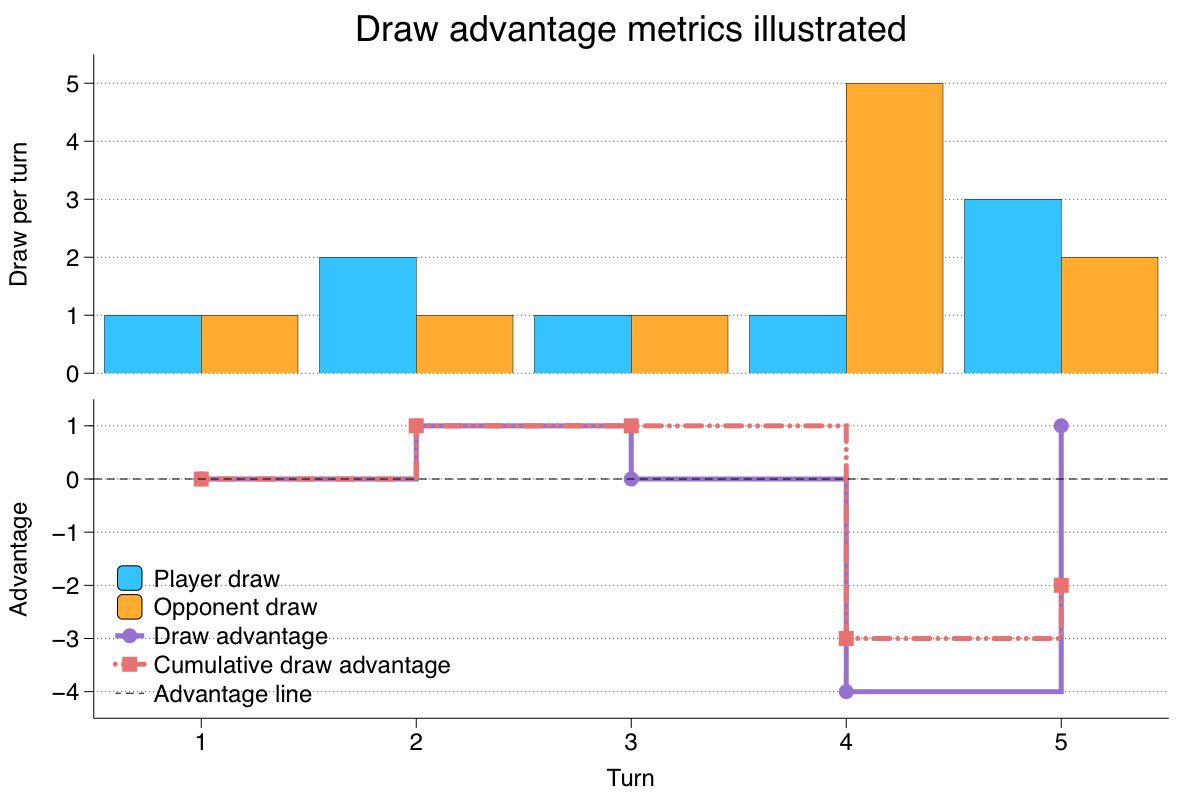
There are two flavors for each metric: the regular version, which represents the value of the metric for the current turn, and the cumulative version, which represents the sum of the metric over all the turns. To illustrate the distinction between the two flavors, let’s look at how the draw advantage and the cumulative draw advantage are computed over the turns with a short example.
The graph below summarizes how the draws and the metrics behave during the example. The top graph shows how many cards are drawn in each turn. The player is in blue and their opponent is in orange. The bottom graph depicts how the draw advantage metric and the cumulative draw advantage metric behave. The draw advantage is represented by a purple line and the cumulative draw advantage by the dotted light red line.
Here is a run-through of the example:
-
Turn 1: Both players draw one card (top graph) so both metrics are worth 0 (lower graph).
-
Turn 2: The player draws two cards while their opponent draws only one card. Therefore, the player now has a one-card advantage. As result, both advantage metrics jump to 1.
-
Turn 3: Both players draw one card again. As a result, the draw advantage metric reverts to 0 but the cumulative draw advantage metric stays at 1, as it takes into account previous turns.
-
Turn 4: This is a big turn for the opponent, who draws five cards whereas the player only draws one. As a result, the draw metric swings back in the opponent’s favor and, therefore, becomes negative: 1 - 5 = -4. The cumulative metric also becomes negative but a little less so because of the previously accumulated advantage of 1: (1 - 5) + 1 = -3.
-
Turn 5: The player catches up a little by drawing three cards vs two cards for the opponent. As a result, for this turn the draw advantage is positive: 3 - 2 = 1 but the cumulative advantage still favors our opponent due to the previous turn lead: (3 - 2) - 3 = -2.
All in all, it is expected that the best predictors of a game will be the cumulative metrics as they carry the history of the game.
In this post, we simply look at cumulative metrics, but there are many other ways to track values over time, such as the different flavors of moving average, which may help in making more accurate predictions. Using those is left as potential future work, if the use of metrics becomes popular.
Predictive power of the metrics
Let’s now look at how effective the metrics are at predicting game outcomes. The simplest way to evaluate if the metrics are useful in predicting a win is to see if they correlate with the game outcome turn after turn.
The correlation aims at measuring the extent to which when a metric value increases, the odds of winning increase and when it decreases, the odds of losing increase.
Performing this correlation analysis on 50,000 replays using the Pearson correlation yields the following graph:
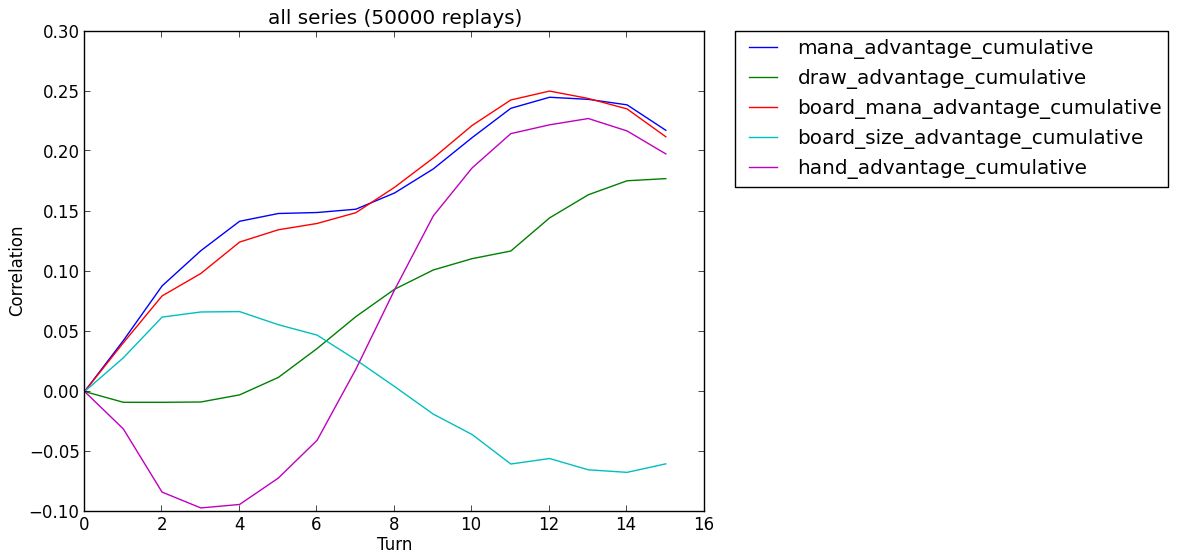
This graph yields a few interesting insights:
-
Mana advantage is key: Spending mana efficiently over the turns (blue line) and building a valuable board in terms of mana (red) are two key ingredients to success. This is expected as card power is (almost) perfectly represented by their mana cost, so the more mana you have in play, the more power you have.
-
Hand advantage is a double-edged sword: The hand advantage metric (purple line) has an interesting dynamic: in the first few turns, having the advantage is bad, while in later turns it becomes a good thing. This dynamic can be explained as follows.
If you have the card advantage in the first few turns, that means you haven’t spent your mana efficiently and you have let your opponent gain an edge. This is particularly true for turns 3 and 4. If you haven’t played cards during those key turns, you are likely to lose.
Conversely, if you have the card advantage in a later turn, you have more options and can make an optimal play instead of playing what you’ve got.
-
Flooding the board is only viable for short games: Having the board advantage in terms of the sheer number of creatures only gives an edge till turn 6. After this, having low-quality minions becomes a liability, as they are overpowered by more powerful cards. Therefore, aggressive decks need to win by turn 7 or 8, because after this, it becomes linearly harder for them (this matches the community wisdom, which is a good thing!). Putting this into practice means that a shaman aggressive deck should likely stop trying to control the board after turn 4.
-
Card draw only matters in a medium to long game: Before turn 5, drawing is negatively correlated with winning and after this, the value of drawing increases almost linearly (green line). This means that it is not a good use of mana to draw in the early turns and the more you wait to draw, the better off you are. This seems to indicate there is a simple rule of thumb: Hold the draw until you have no other or no better option. Of course, as every rule, I am sure there are exceptions :)
In-depth metric analysis
In this section, we take a closer look at how the “intensity” of the mana advantage metric and hand advantage metric affect the win rate.
Mana efficiency
Thanks to the previous section, we now know that the cumulative mana advantage metric is one of the two most important metrics in predicting game outcomes. However, we still don’t know the relation between the size of the lead and the odds of winning.
In other words, what we are trying to figure out is, if I lead the mana advantage by 3 mana, how much more likely am I to win in contrast if I only have a 2-mana lead.
To answer this question, I computed the mana advantage for each turn of the 50,000 replays and looked at the odds of winning for each value of the mana advantage from a 10 mana deficit (-10) to a lead of 10 mana (+10). This gives us the following plot:
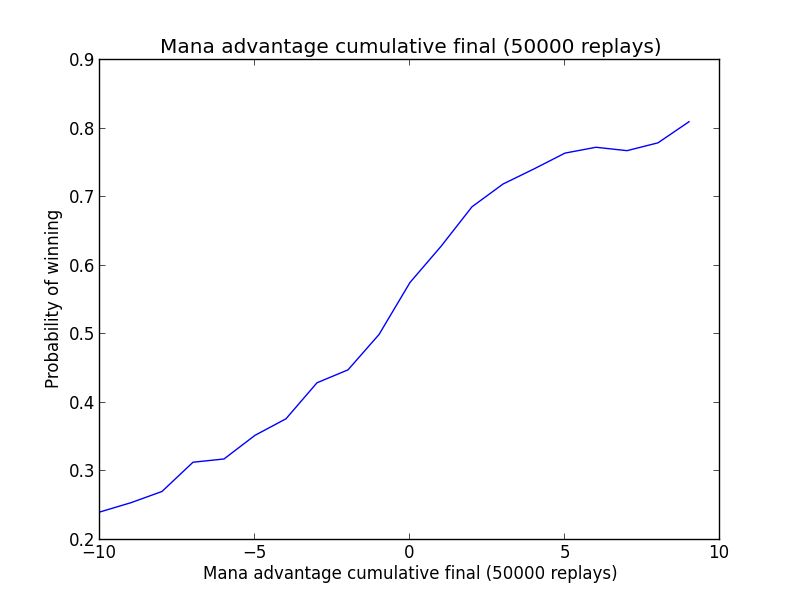
This curve tells us that when there is a deficit of -10 mana, the odds of winning are less than 25%. On the opposite end of the spectrum, having a 4-mana lead pushes the chance of winning to roughly 70%. Having a bigger lead offers a diminishing return, which emphasizes the need to not overextend and to play conservatively when leading. Finally, we note that the almost linear relation between winning and the size of the lead is consistent with our card model.
Hand advantage
Interestingly not all the metrics behave in a linear (straight line) fashion. The best example of an unusual relation between the size of the lead and the odds of winning is the hand advantage.
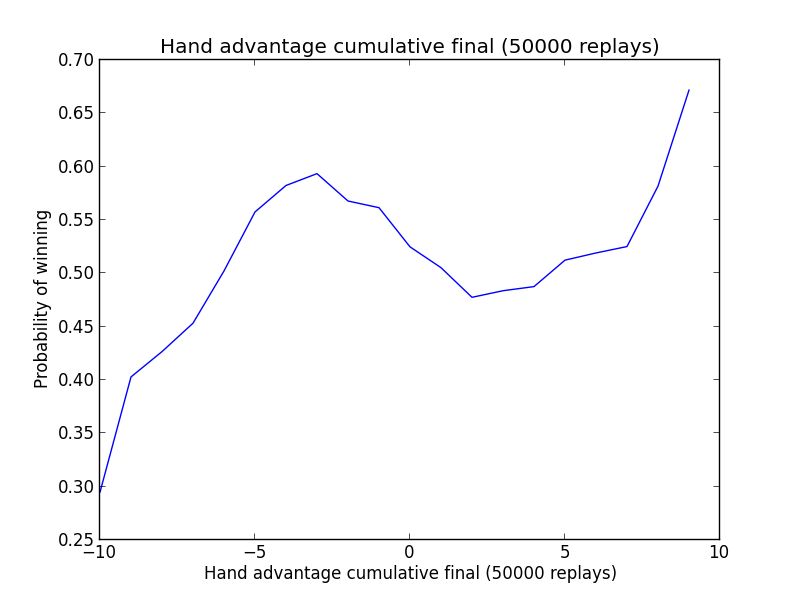
The shape of the curve in the graph above shows two distinct patterns that correlate with a higher win rate. The first pattern indicates that you increase your odds of winning by playing three or four cards more than your opponent. Note that the curve also shows that if you played way more cards than your opponent (>5), you are diminishing your chance of winning significantly.
The other winning pattern (the right side of the graph) is when you have way more cards than your opponent. This is the pattern you expect from a successful control or combo deck.
All in all, I believe that both patterns having a nice win rate is important for the health of Hearthstone as it shows that both midrange and control decks are viable. Wouldn’t it be cool to have a health dashboard that show those metrics over time so we know that our favorite game is healthy?
Predicting game outcomes
The best way to use our metrics to predict game outcomes is to use a machine-learning algorithm because the metrics not only have different predictive powers but also this predictive power changes through the turns. Accordingly, it is best to let the AI figure out how to combine them efficiently rather than creating imperfect manual rules.
To achieve this, I converted the metrics into feature vectors and applied some of the most common machine learning algorithms to 50,000 replays. I used 45,000 for training the algorithm and 5000 for testing their accuracy. The resulting accuracy for the various algorithms is reported on the following diagram:
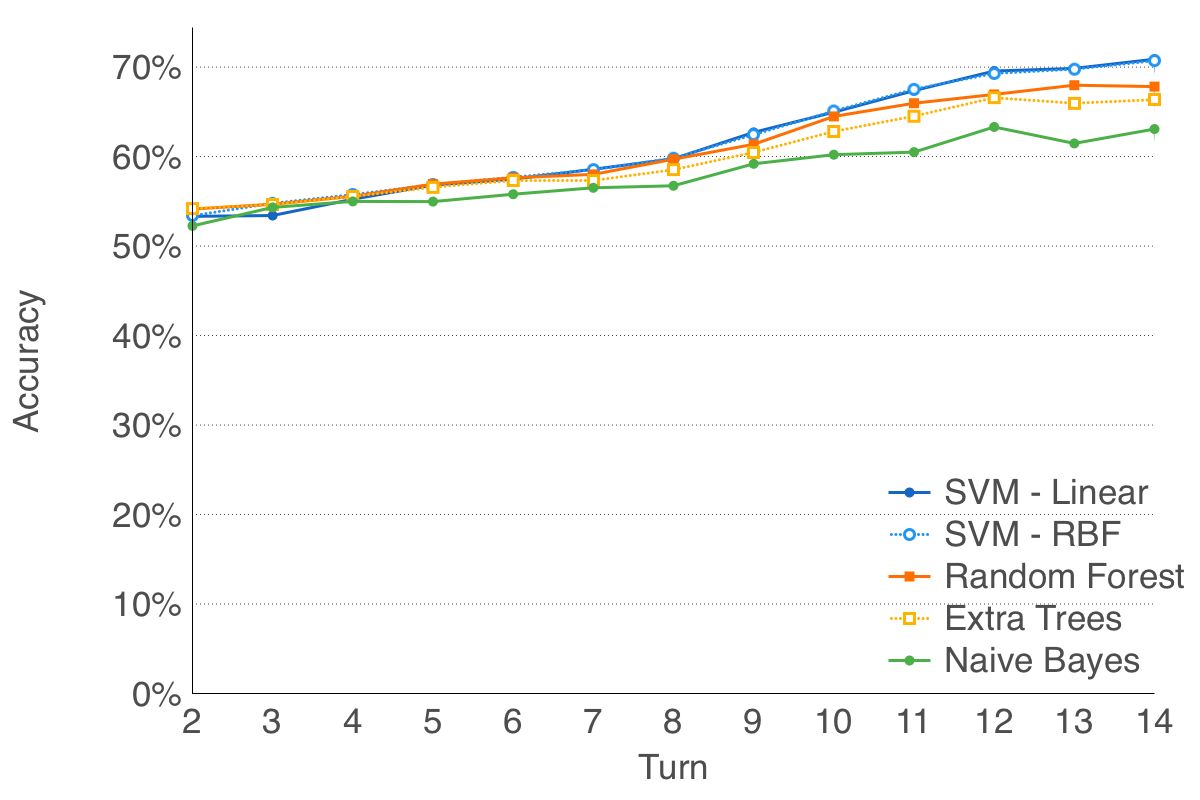
As you can see, every algorithm is able to beat the baseline and they become better as turns pass. This make sense, as more information is available. The best classifier is the SVM algorithm with both kernels having almost the same accuracy (RBF and linear).
On one hand, it is fun to see that using only the metrics, the classifiers are able to predict somewhat accurately the results of a game. On the other hand, that a classifier doesn’t reach a super high accuracy (90% or something) means that it needs more information (aka features). Maybe adding the hero current health and class may help. It seems it has good potential for future work if there is a need for such a classifier.
Why having a lot of data is important
A prerequisite to reaching any meaningful conclusion during such analysis is having access to a lot of data. The best way to illustrate this, is to show what the metric analysis would have looked like with 100, 1000 and 10,000 replays.
Here is what the mana advantage graph would have looked like:

As visible, the 100- and 1000-replay curves are meaningless and only the 10,000-replay curve is starting to look like the one we have at 50,000 replays. This is why I am not 100% sure that 50,000 replays is enough even though the shape of the curve stabilized around 25,000 replays. Ideally you would want millions of replays to ensure that the analysis is 100% correct, which is why I am really excited to see crowd-sourced efforts happening.
For metrics that are more oddly shaped, like hand advantage, not having enough data produces even worse results, as visible in the chart below:

Thanks for reading this post to the end! If you enjoyed it, don’t forget to share it on your favorite social network so your friends and colleagues can enjoy it too.
To get notified when the next post is online, follow me on Twitter, Facebook, Google+. You can also get the full posts directly in your inbox by subscribing to the mailing list or the RSS feed.
